What Happened to the Incentive to Earn? Hidden Bracket Creep in Germany’s Child-Support Schedule.
Across 18 years, the income bands stayed the same width and in 2026, a parent of two teenagers can earn anywhere from €1,450 to about €2,500 of adjusted net income without keeping a euro more.

Part 2 — The full schedule, 1979–2026
Part 1: The first income band, 1979–2026 →
Dieter Joenssen · 27 Oct 2026
Key findings (Part 2)
F1. A parent of two teenagers keeps none of any additional income between €1,450 and €2,497 of adjusted net income, and up to €2,629 if the control-amount downgrade is not applied. Of a €100 gross raise at €3,780 a month, €2.75 remains.
F2. Above the first band, every band border is a notch. The payment jumps by the full step (€64–106 for two teenagers), and earning more leaves the parent with less until the step has been earned back. Across the whole table, these dead stretches add up to exactly the top band’s payment amounts, €2,353 for two teenagers, with or without the downgrade.
F3. The steps are indexed, the bands are not. Bands 2 to 10 have been €400 wide since 2008, while the steps between them grow with the statutory minimum (+79 percent for a teenager). For two teenagers, the step now takes 16 percent of a band’s width in the lower bands (9 percent in 2008) and 26.5 percent in the steepest bands, the highest value since 1979.
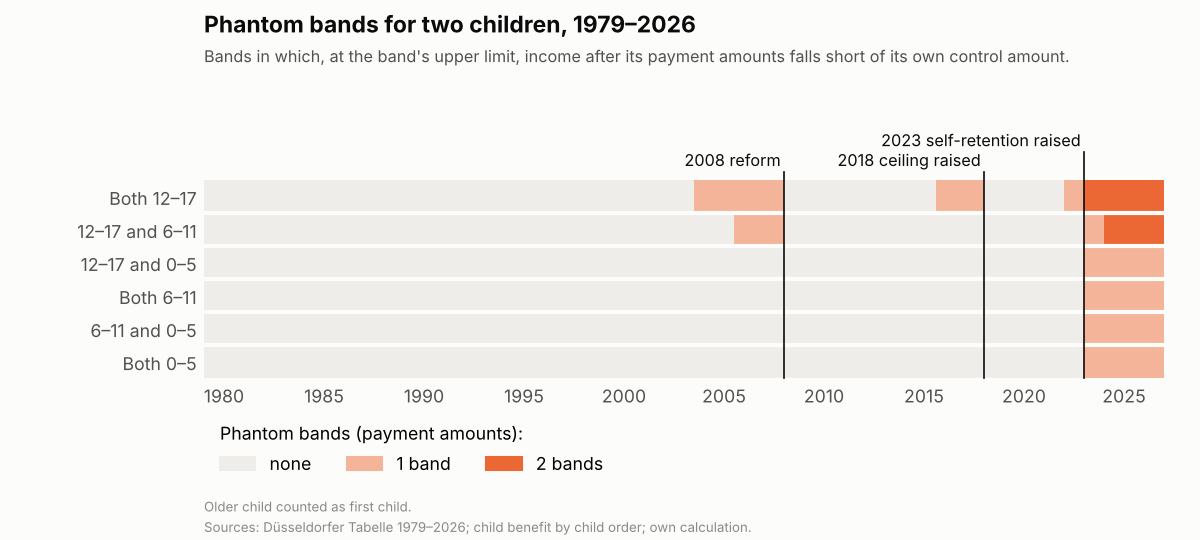
F4. Since 2023, every two-child household has at least one phantom band: a band in which, even at its upper limit, income after its payment amounts falls short of its own control amount. For two teenagers, bands 2 and 3 are phantom bands. Before July 2003 there were none.
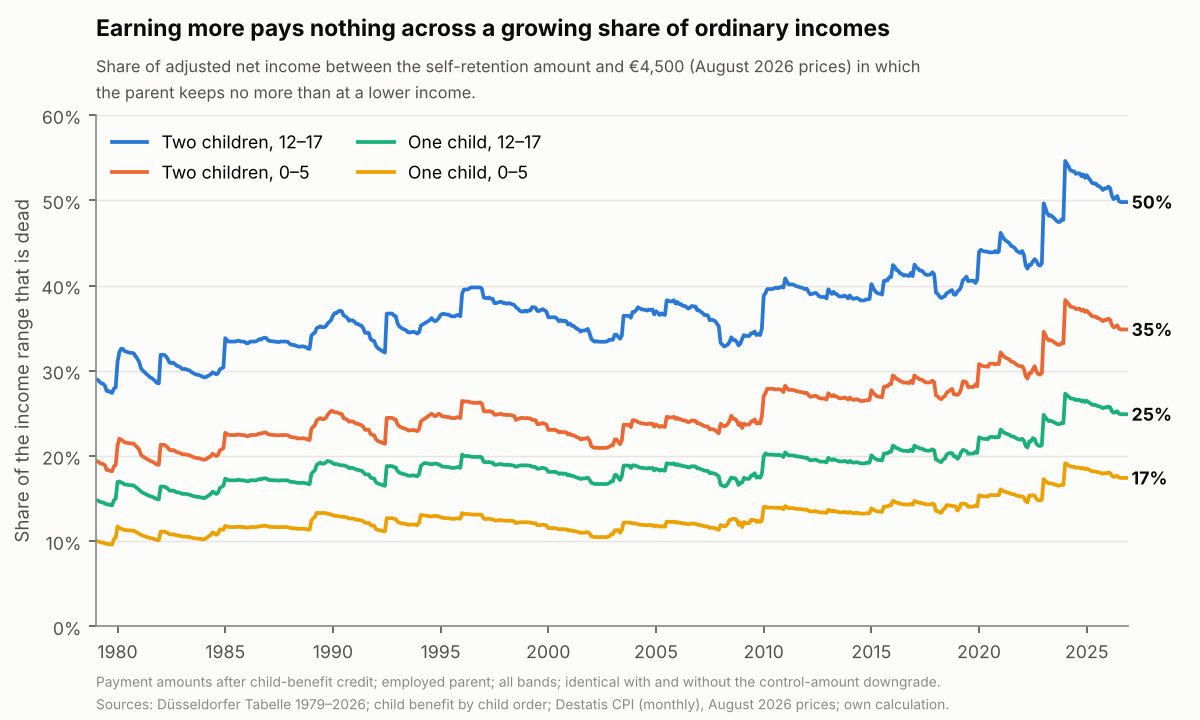
F5. For two teenagers, the share of adjusted net income between the self-retention amount and €4,500 in which earning more pays nothing rose from 29 percent in 1979 to 50 percent in 2026. For one teenager it rose from 15 to 25 percent.
F6. A parent who separated in 2012 and whose income rose with average earnings gained €312 a month in real terms by 2026. What the parent kept after child support rose by €21. Since 2021, nothing has been left above the self-retention amount in any year.
F7. The table passes every test of its internal arithmetic and fails both tests of its design: since 2010 its own reference household of two dependents no longer fits into its lowest band, and since 2023 its control amounts and printed amounts can no longer both hold for any two-child household.
F8. The two parameters tied to external benchmarks (minimum support, self-retention) are adjusted edition after edition; the band structure has no rule attached and has not been widened since 2008.
Note: payment amounts after the child-benefit credit unless stated otherwise; 2026 table; employed parent with a self-retention amount of €1,450; real values in August 2026 prices (Destatis CPI). “Two teenagers” means two children aged 12–17.
1. A raise worth €2.75
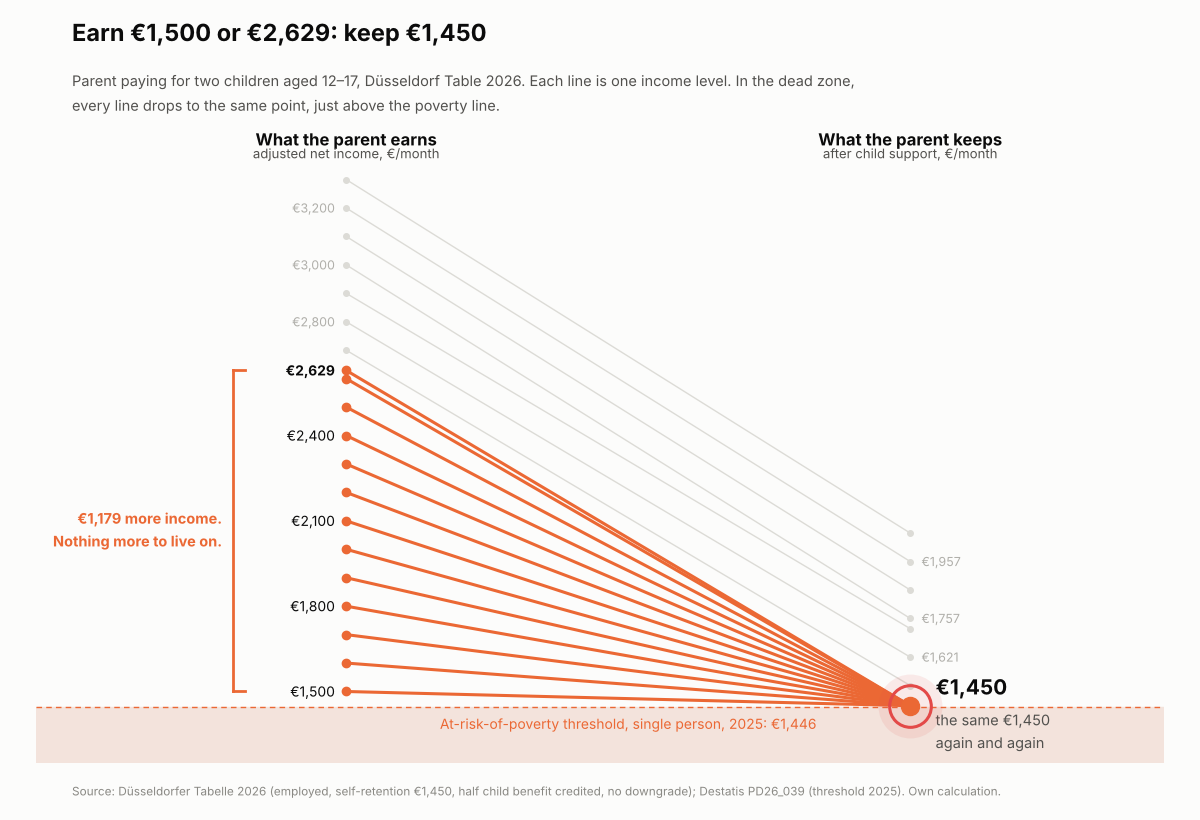
Consider a parent who pays child support for two teenagers, aged 17 and 15. The parent earns €3,780 a month before taxes, a little over €45,000 a year, or about 84 percent of the median full-time salary in Germany (Destatis: median gross annual earnings of full-time employees, 2025). After income tax and social contributions, €2,526 reaches the parent’s account. For this illustration, I assume a 5 percent deduction for work-related expenses, leaving €2,400 in adjusted net income (bereinigtes Nettoeinkommen), the figure the Düsseldorf Table works with.
The table asks €523.50 a month for each teenager, €1,047 in total. The parent can pay €950. The rest is protected by the self-retention amount (notwendiger Selbstbehalt) of €1,450, the share of income the table never touches. After child support, the parent lives on exactly that: €1,450 a month, four euros above the at-risk-of-poverty threshold for a single person (Destatis: at-risk-of-poverty threshold 2025), part of a relationship that Part 1 showed has persisted for more than three decades.
Now the parent gets a raise of €100 a month. The employer pays about €120 once its own social contributions are added. Income tax and the parent’s contributions take €44.92. Under the same 5 percent assumption, €2.75 is treated as work-related expense and the remaining €52.33 increases payment capacity, because every euro above €1,450 goes to the children until their payment amounts are covered.
The parent keeps €2.75, which the table assumes is spent on getting to work.
None of this says anything against the children’s claim. The money reaches them, and that is what the system is for. It says something about the incentive. From the employer’s €120 additional cost, the parent keeps €2.75: a combined tax, contribution and child-support wedge of about 98 percent. Measured from adjusted net income, the child-support system alone absorbs 100 percent of the marginal euro until full payment capacity is reached.
Part 1 explained why this happens in the first income band. Between the self-retention amount and the income at which full child support can be paid, every additional euro goes to child support. That band has been narrowing for decades, and for two teenagers it has not covered the full payment since 2023. Part 1 stopped there on purpose. The schedule has fifteen bands, and a parent who earns more moves up through them.
Does the rest of the schedule give back what the first band takes?
This part follows the same parent up the ladder: all fifteen bands, with and without the control-amount downgrade that the table permits. It then goes back in time and follows the parent from the separation in 2012, when the children were 3 and 1, to today, with the table that actually applied in each year. Finally, it measures the table against its own stated claims.
The short answer is no. Above the first band the ladder is steeper than it looks. For exactly this household its first rungs are missing, and since 2008 it has ratcheted steadily upward, for reasons no one has decided on.
2. Looking up the ladder
The obvious way out of the first band is to earn more. A promotion, a better-paid job or regular overtime moves the parent into band 2, then band 3 and beyond, and the table’s amounts rise with the band. The question is what happens to the parent’s own income along the way.
Two things happen at once. The first is familiar from Part 1. As long as income is too low to cover the children’s full payment amounts, every additional euro goes to child support. For two teenagers in 2026, that zone does not end in band 1. It runs from the self-retention amount of €1,450 to €2,497 if the table’s control-amount downgrade is applied, and to €2,629 if it is not.1 Over that whole stretch, a parent who earns more keeps exactly what a parent who earns less keeps.
The second is new. Each band has its own payment amounts, and they rise in steps. Crossing a band border raises the payment by the full step at once. For two teenagers, the step is €64–66 at the lower borders and €104–106 from €3,700 upward. At €3,700 the parent keeps €2,391. One euro more and the parent is in band 6, the payment rises by €104, and the parent keeps €2,288. The parent has to earn the step back, another €104, just to return to where they were.
These are the notches. In public-finance terminology, this is literally a notch: a discrete jump in liability at an income threshold. Notches can create a dominated region immediately above the threshold in which earning more leaves a person worse off than remaining below it (Kleven and Waseem 2013, Using Notches to [...]; Kleven 2016, Bunching). Inside a notch, earning more leaves the parent with less, a marginal burden above 100 percent. Together with the first zone, they mark every stretch of income in which a raise is worth nothing.
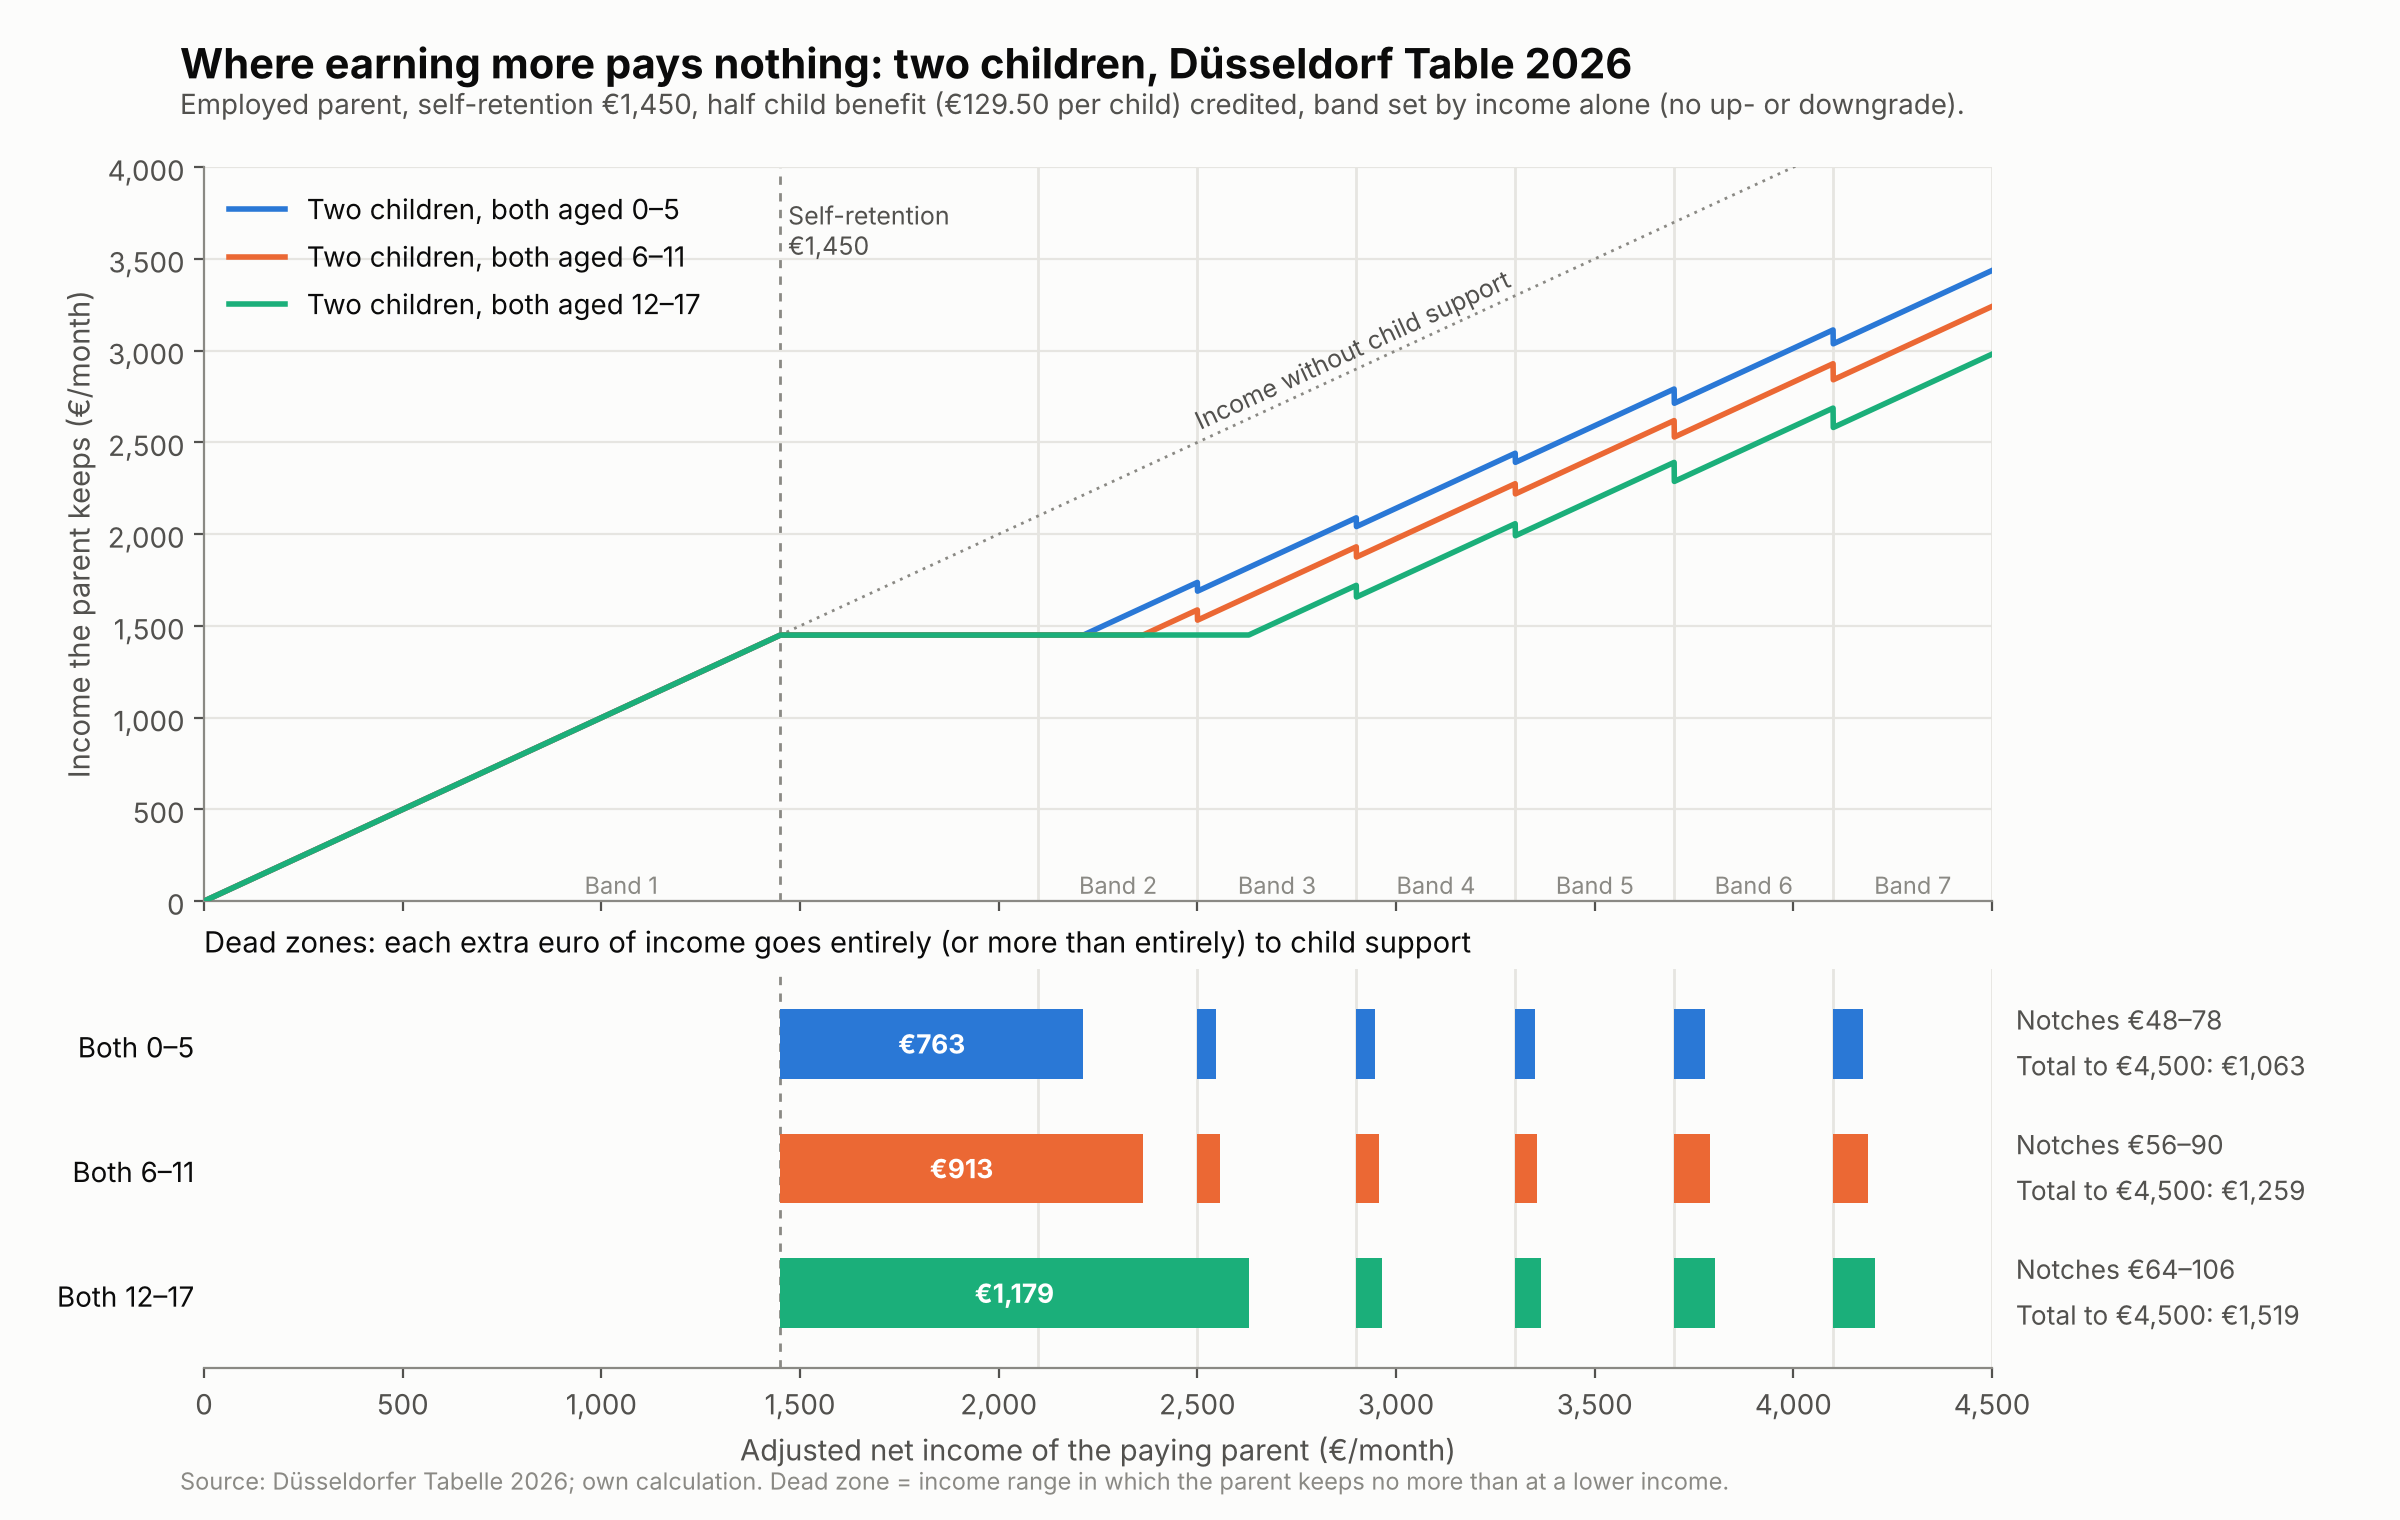
Figure 2 shows how much of the ladder is affected. For two teenagers, €1,519 of the €3,050 between the self-retention amount and €4,500 is dead: half of the income range in which most ordinary salaries fall. The notches look narrow on the chart, but each one is a full step that has to be earned twice, once to cross the border and once to recover from it.
One property of the schedule makes this precise. Across all fifteen bands, the dead stretches add up to exactly the top band’s payment amounts, €2,353 for two teenagers.2 Every euro of child support the table can ask for corresponds to one euro of income the parent earns without keeping it. The downgrade does not change that total. It only changes where the dead stretches sit: the first zone ends earlier, at €2,497, and the notches move to €2,863, €3,029, €3,193 and €3,359, where the higher bands’ control amounts are first met.
For one child, the picture is milder. The first zone never leaves band 1, in any year since 1979, and only the notches remain: €32–53 at each border for a teenager in 2026. The notches exist with one child as well. What changes with two is their scale: the initial dead zone can extend beyond band 1, entire printed bands can become unusable under the control-amount rule, and two children are precisely the reference household the table says its amounts are built around.3
What does a raise feel like from inside a band?
Figure 3 answers that from the parent’s point of view. It shows, for every income, which share of everything earned since the last band border has gone to child support. Right after a border, that share is well above 100 percent: the parent has earned a few euros more and paid the whole step. Once the step has been earned back, the share falls to 100 percent and keeps falling until the next border. It reaches its lowest point only at the very top of the band: 16–17 percent in bands 4 and 5, and 26 percent from €3,700 upward.
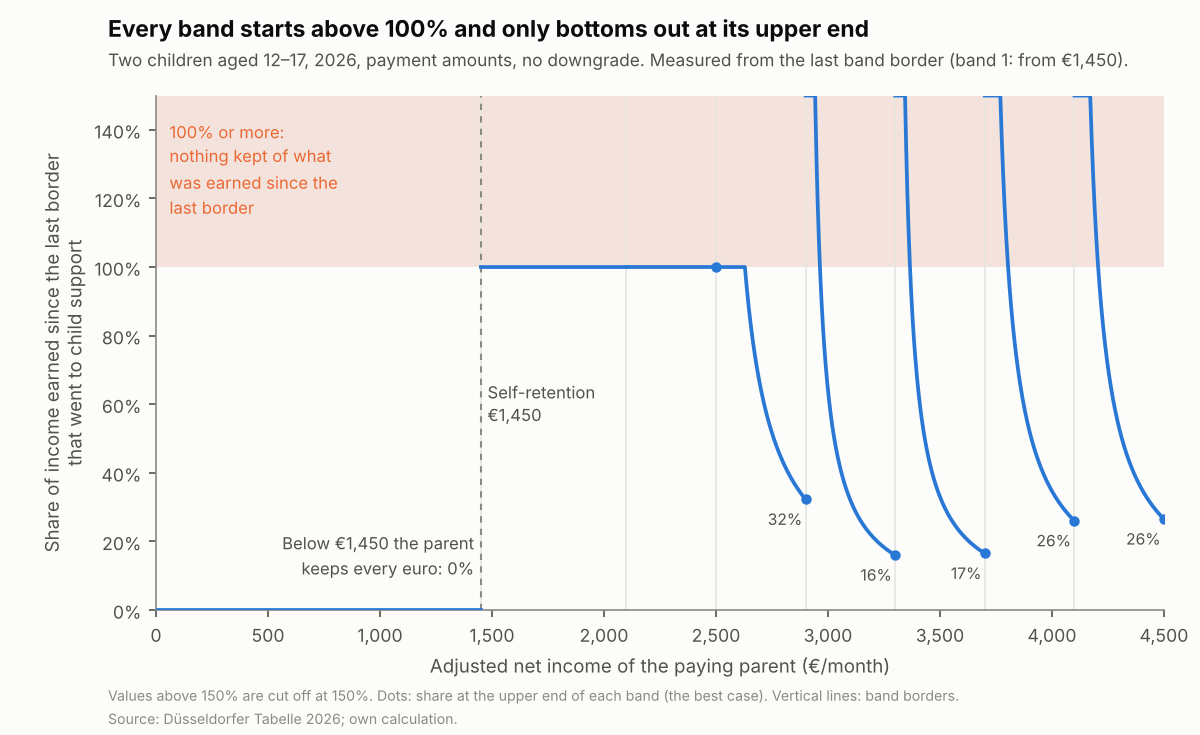
The 26 percent is an average across a band, and nobody experiences the average. Take an extra €100 of adjusted net income for a parent somewhere between €3,700 and €5,700. Three quarters of each €400 band lies more than €100 below the next border; the remaining quarter lies within €100 of it. A parent in that final €100 who receives a €100 increase crosses the border, pays the €104–106 step, and ends the month €4–6 worse off than before the raise. How many parents actually occupy that part of the band is an empirical question, taken up in Part 3. A raise is either free or a loss, and which one depends on where in the band the parent happens to stand.
So the ladder above band 1 does not give back what the first band takes. It adds a toll at every rung. That distinction is relevant because recent labor-supply research has treated Germany’s ‘lumpy’ formula as potentially less distortionary than a continuous income-linked obligation. Ong (2025, The Effect of Child Support on Fathers’ Labor Supply) explicitly excludes Germany from his empirical design because support is constant within income bands, and later suggests that wide bands may avoid poor incentives from small income changes. Inside a band, that intuition is correct. At the border, however, the same lumpiness creates the notch documented here. Whether wide bands improve incentives therefore depends on how large the step becomes relative to the width of the band. This is exactly the quantity Figure 4 tracks. And as the next section shows, that toll has been rising since 2008, while the rungs have stayed exactly where they were.
Footnotes:
- Since 2025 the table states that the band below “can” be applied when a band’s control amount (Bedarfskontrollbetrag) is not met. Until 2024 the wording was “is to be” applied. Courts have treated the downgrade as discretionary since BGH, XII ZR 161/98 (2000), and the higher regional courts’ guidelines handle it differently. I therefore show both readings throughout. See the note at the end.
- Let Pj denote the household’s total payment amount in band j. The initial dead zone contributes Pk, the payment amount of the band in which it ends (k = 1 with the downgrade; for two teenagers without it, k = 3); each subsequent notch contributes the increase in liability at the next band border. Hence
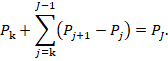
The equality is therefore mechanical, not a numerical coincidence.
- Since 2010 the table has stated that its amounts are calibrated to two dependents, regardless of rank (bezogen auf zwei Unterhaltsberechtigte, ohne Rücksicht auf den Rang).
3. Why the ladder keeps getting steeper
The toll at each rung is not fixed. It is set by two numbers that the table treats very differently.
The step from one band to the next is a percentage of the band-1 amount, five or eight percentage points depending on the band. The band-1 amount is the statutory minimum support (Mindestunterhalt). It is tied by § 1612a BGB to the tax-exempt material subsistence minimum of a child. That benchmark is itself rooted in measured household expenditure: the underlying standard needs are re-estimated from the Income and Expenditure Survey (EVS), conducted every five years, and between surveys are updated through a statutory factor procedure that weights relevant prices at 70 percent and net wages at 30 percent. Since 2023, an additional short-term price adjustment has been applied. The minimum support therefore inherits an external updating mechanism. The band widths do not. The width of a band, the distance between two rungs, is set by the commission that publishes the table, and for bands 2 to 10 it has been €400 since 2008.
For two children the share of a band’s width that the step consumes is

where M is the minimum support, ∆p the percentage step and w the band width. Since 2008, only M has moved. For a teenager it rose from €365 to €653, by 79 percent, and the share rose with it.
The result of indexing steps and not bands is traced in Figure 4. For two teenagers, the step in the lower bands took 9 percent of a band’s width in 2008 and 16 percent in 2026. In the steepest bands, from €3,700 to €5,700, it rose from 15 to 26.5 percent, the highest value in any edition since 1979. The share has not fallen once since 2008. It stood still only in the years when the minimum stood still.
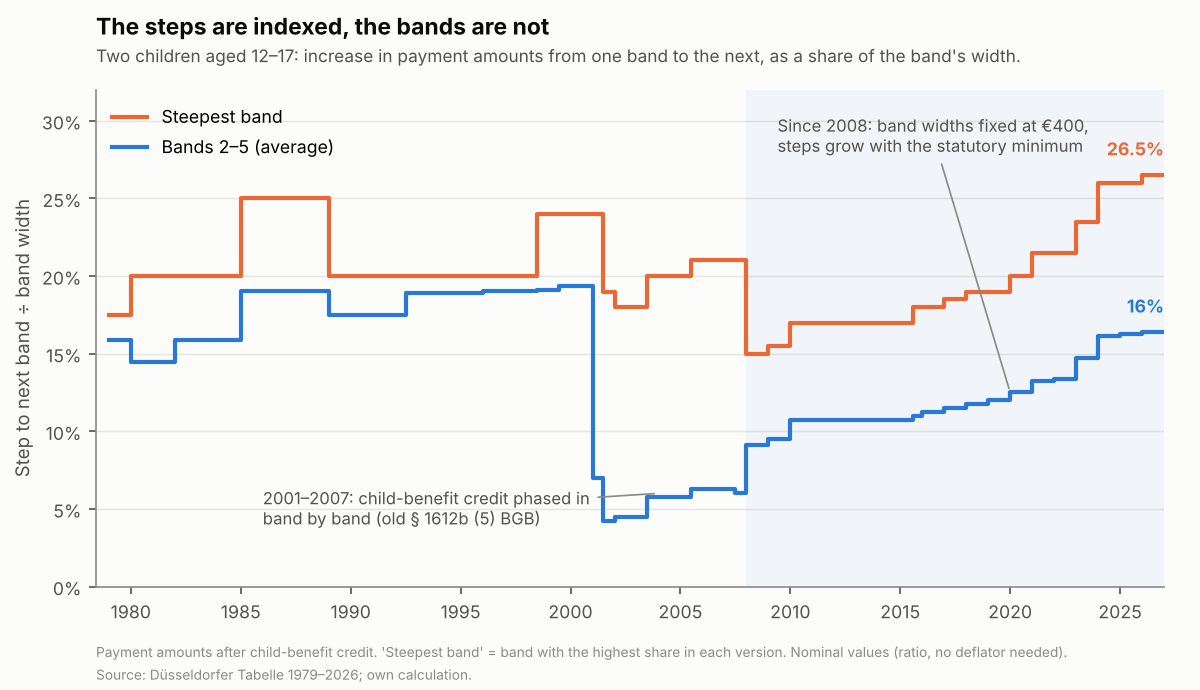
This is bracket creep in its classic form, mirrored. In income tax, fixed brackets meet rising incomes. Here, fixed brackets meet a rising levy. As nominal earnings rise with inflation, they move through fixed bands, while each band costs more to cross.
The commission is aware of the fixed widths. The presiding judge who introduces the table each year names them explicitly (Rake, FamRZ 2025, 149). They are known. They just aren’t adjusted, because no rule says they should be.
What happens at the bottom of the ladder, where the steps meet the control amounts?
Each band above the first has its own control amount (Bedarfskontrollbetrag): the income the table considers necessary for a balanced split between parent and children in that band. It rises by €100 per band, except at the first step, where it jumps by €300, from €1,450 to €1,750. If paying a band’s amounts would push the parent below that band’s control amount, the table says a court can apply the band below.
Whether a court does so depends on where the parent lives. The table’s wording changed in 2025 from “is to be applied” to “can be applied”, precisely to accommodate diverging regional practice (Rake, FamRZ 2025, 149, 152):
- Bremen’s guidelines require the check.
- The guidelines of North Rhine-Westphalia and southern Germany leave it to the court.
- The Kammergericht in Berlin and the court in Naumburg do not adopt it at all.
Where the check is not used, the only protection left is the self-retention amount of €1,450.
For the household the table is built around, both practices fail. I call a band a phantom band for a given household if, at the band’s upper limit, the income left after paying the band’s amounts falls short of the band’s own control amount. What happens then depends on the court:
- Where the control amounts are applied, a phantom band’s amounts never apply anywhere in its own income range. The household is assessed in a lower band until well into the next one.
- Where they are not applied, the band applies as printed, and the parent ends up below the income the same table describes as necessary, protected only by the self-retention amount.
Either the band is empty, or its control amount is a number without effect.
For two teenagers in 2026, bands 2 and 3 are phantom bands. At the top of band 2, €2,500, paying the band-2 amounts would leave €1,387, which is €363 short of the band’s control amount and below even the self-retention amount. The German pension insurance uses exactly this case, two children aged 13 and 15 at €2,500, as a worked example in its own administrative guidance (Deutsche Rentenversicherung: Gemeinsame Rechtliche Anweisungen zu § 48 SGB I, Beispiel 6). Where the check is applied, the parent is moved to band 1. Where it isn’t, the parent keeps €1,450 and the band-2 amounts are not covered either. At the top of band 3 the parent is still €129 short of that band’s control amount. Only in band 4 does the household first fit into its own band. Figure 5 shows the bands the table prints for each income next to the bands whose amounts survive the control-amount check.
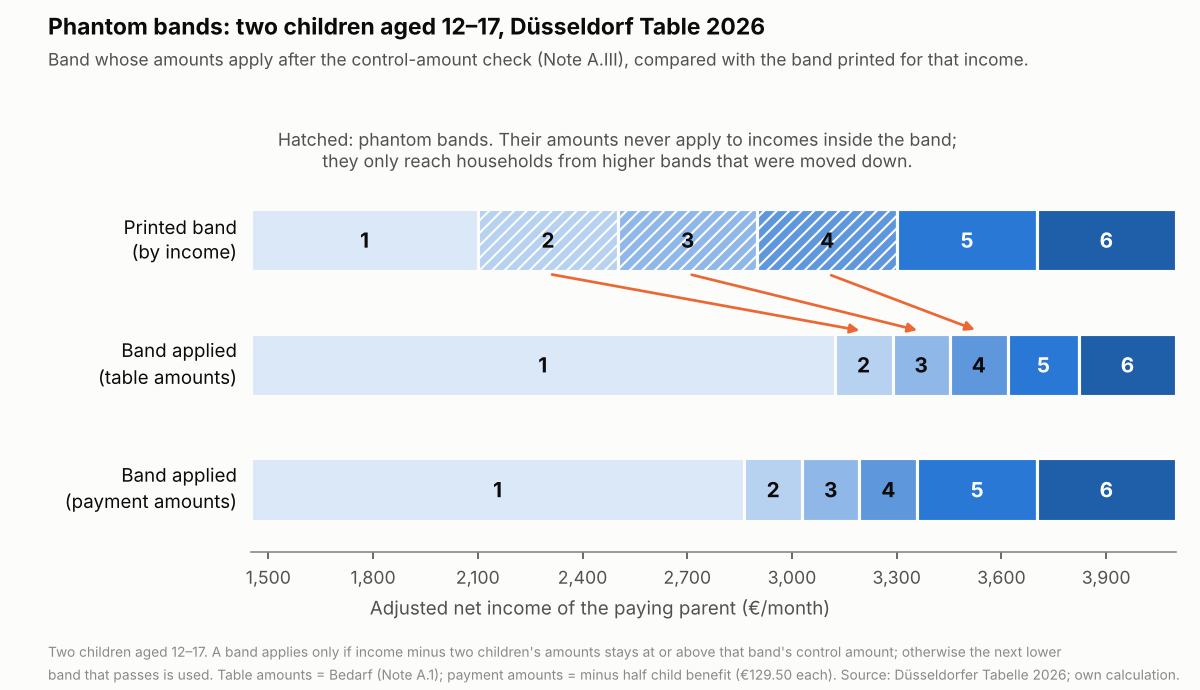
For exactly the household the table is built around, the first rungs of the ladder are missing, or they exist only by setting aside the table’s own control amounts. This is not a quirk of teenagers. Since 2023, every combination of two children, from two toddlers to two teenagers, has at least one phantom band. Two toddlers miss band 2 by €13, but they miss it over its entire range.
Figure 6 shows how recent this is. Before July 2003 there was no phantom band for any two-child household. They appeared for two teenagers between 2003 and 2007, disappeared with the 2008 reform, came back from 2015 to 2017, disappeared again when the first band’s ceiling was raised in 2018, came back in 2022, and in 2023 spread to every combination. Each time they vanished, it was a side effect of moving the ladder, never a correction of its rungs.
Two calculations show where this leads:
- The counterfactual: what if the band widths had risen with the minimum since 2008, to roughly €700 instead of €400?
- The scenario: what would happen over the next ten years if the band limits remained unchanged, while payment amounts grew by an illustrative 2.3 percent a year and control amounts by 3 percent a year?
|
Two children, payment amounts |
0–5 |
6–11 |
12–17 |
|
Phantom bands, 2026 actual |
1 |
1 |
2 |
|
Widths indexed to the minimum |
0 |
0 |
1 |
|
Illustrative 2031 scenario, |
2 |
3 |
4 |
|
Illustrative 2036 scenario, |
5 |
6 |
9 |
The purpose of these scenarios is to show the direction of the mechanism: whenever payment and control amounts continue to rise while nominal band widths remain fixed, additional phantom bands emerge.
Indexing the widths would have removed almost all of the problem. Leaving them alone multiplies it. In the scenario, more than half of the fifteen bands become phantom bands for two teenagers within ten years. Rising amounts and rising control amounts each add phantom bands on their own, and together they add more than the sum of both. Whatever a court decides about the downgrade, every one of those bands is a band in which the table’s printed amounts and its own control amounts cannot both hold.
The ladder gets steeper for one reason: the part of the schedule that rises automatically keeps rising, and the part that would have to be adjusted by someone is not.
4. How we got here
The parent from Section 1 did not start in the dead zone. Go back to 2012, the year of the separation, when the children were 3 and 1, and follow the household forward with the table, the child benefit and the prices that actually applied in each year. For an illustrative wage-indexed income path, let the parent’s adjusted net income rise at the same rate as average earnings in Germany, scaled to reach €2,400 in 2026. In real terms, at August 2026 prices, that path rises from €2,092 in 2012 to €2,404 in 2026: about 15 percent more purchasing power over fourteen years.1
Figure 7 shows what the table made of it. The shaded area is the dead zone in each year, in today’s prices. The blue line is the parent’s income.
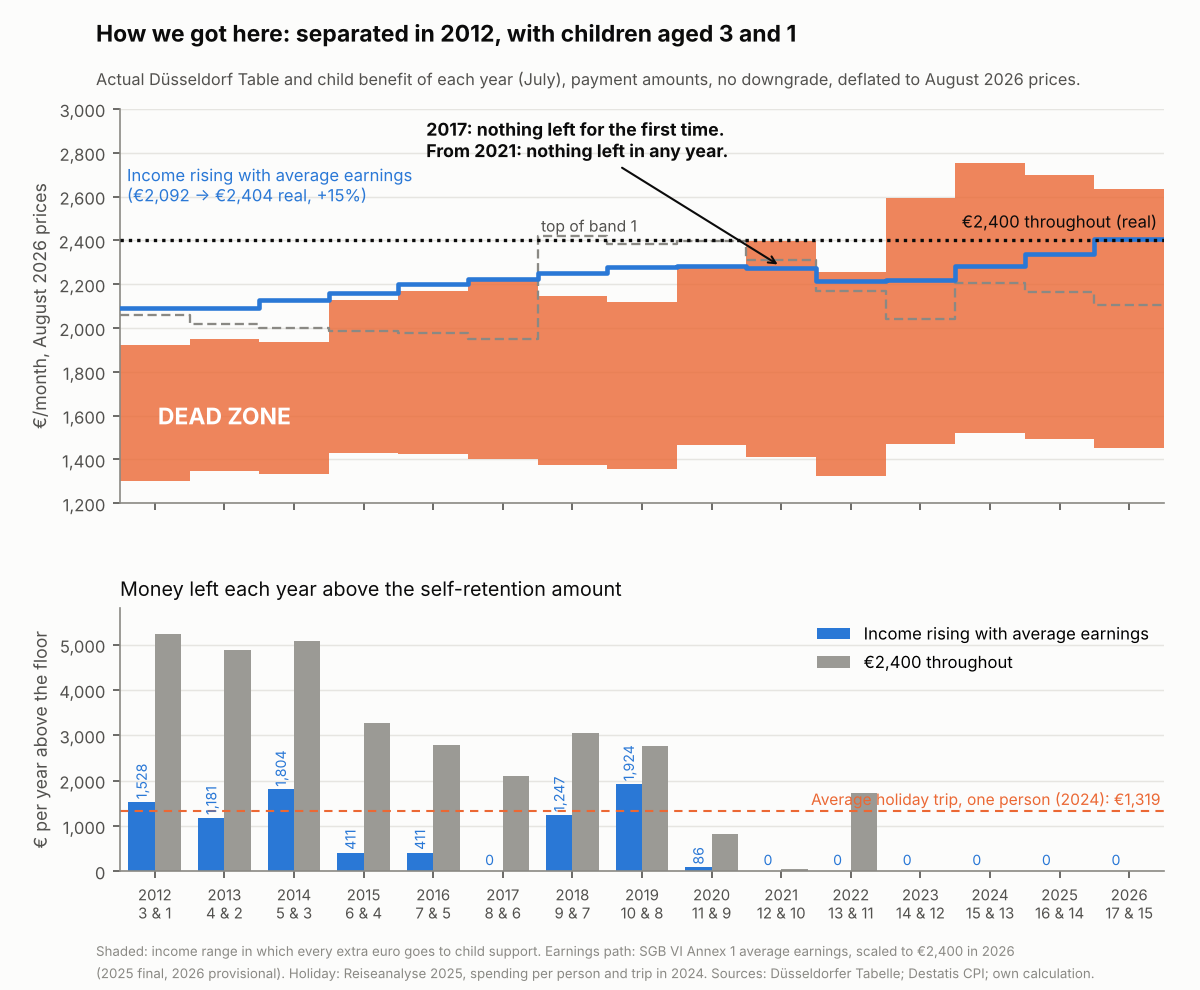
In 2012 the parent was above the zone. After child support and the self-retention amount, about €1,500 a year was left over at today’s prices, roughly what an average holiday trip cost one person in 2024 (Reiseanalyse 2025: €1,319 per person and trip). Then the floor of the zone and its upper edge began to move, and they moved faster than the parent:
- The children aged. At 6 and again at 12, each child moves into an age group whose amount is 13 and then 17 percentage points higher. That is a statutory spread, not a measured difference in cost.
- The minimum support rose with the subsistence minimum of a child.
- The self-retention amount rose with the cost of living of the parent.
The parent’s income rose as well, but more slowly than the zone rose around it. In 2015 the margin fell to about €400 a year. In 2017 it was gone. In 2018 and 2019 it came back, but not because the parent earned more: the commission raised the ceiling of the first band, and the zone briefly dropped below the parent’s income. From 2021 onward, nothing was left in any year.
Over the whole period, the parent’s income rose by €312 a month in real terms. What the parent kept after child support rose by €21, from €1,431 to €1,452. Fourteen years of raises bought €21 a month. In 2026 the parent keeps exactly the self-retention amount, and every raise since has gone to child support. The total margin over fifteen years was about €8,600, and nothing at all in the last six.
The downgrade does not rescue this story. If the control amounts are applied (Appendix, Figure A1), the early years look somewhat better, because band 1 applies for longer while the children are young. But from 2023 nothing is left in that version either, and what the parent keeps falls from €1,474 to €1,452 in real terms: €22 less than at the start, despite fourteen years of real raises.
Is this one unlucky family?
It is not. The same arithmetic applies to every parent with the same household and a similar income. Figure 8 widens the view to the whole range of ordinary incomes. For each month since 1979, it shows the share of adjusted net income between the self-retention amount and €4,500, in today’s prices, in which a paying parent keeps no more than at a lower income.
|
Household |
January 1979 |
August 2026 |
|
One child,
0–5 |
10% |
17% |
|
One child,
12–17 |
15% |
25% |
|
Two children,
0–5 |
19% |
35% |
|
Two children,
12–17 |
29% |
50% |
For a parent of two teenagers, half of the ordinary income range is now dead. It peaked at 55 percent in January 2024. The line moves in a sawtooth. Between two editions of the table, inflation erodes all of its nominal amounts, and the share drifts down. Each new edition resets it, and since 2008 almost every reset has landed higher than the one before. The downgrade changes nothing here: it decides where in the range the dead stretches sit, not how much of the range they cover.
So the parent in Figure 7 is not an outlier who made bad choices. The parent follows an illustrative path indexed to average earnings rather than an unusually weak earnings trajectory. The table, for its part, followed its own rules, and those rules move the zone up faster than an ordinary career moves a parent out of it.
Footnote:
- Income path: average earnings under Annex 1 of SGB VI (2026 provisional), scaled to €2,400 adjusted net income in 2026. Annual snapshots in July; children’s birthdays assumed at the turn of the year; older child counted as first child. Real values in August 2026 prices, deflated with the Destatis consumer price index.
5. The table against its own claims
A fair objection to everything so far: the Düsseldorf Table is a guideline, not a statute, and the courts apply it with discretion. Perhaps it was never meant to deliver what this essay asks of it.
The table does, however, make claims about its own design, while other properties follow directly from the law it implements. That makes a simple test possible, one that requires no legal judgment. Take each stated property or design assumption and ask whether the table’s own numbers remain consistent with it. This is not a legal assessment. It is the same check one would run on any rulebook, comparing what it says it does with what its numbers actually do. I ran that check for every edition from 1979 to 2026.
The two design claims are tested on table amounts, the children’s need (Bedarf), because that is what the table says it is calibrated in. Its notes state that it shows “the monthly need, relative to two dependents”, and that “the need is not identical to the payment amount”.
|
Claim |
Test |
Result |
Evidence |
|
Arithmetic |
|||
|
Amounts
rise with income and with the child’s age |
Every
amount higher than the one before, by band and age group |
Passes in every edition |
All editions 1979–2026 (Methods) |
|
Each band
is a fixed percentage of band 1 |
Amount =
band-1 amount × band percentage, within rounding |
Passes since 1998, with one exception
(adult column, July 2007) |
All
editions since 1998; 2007 checked against the original |
|
Band 1 is
the statutory minimum support |
Band 1
against the statutory formula and the minimum-support ordinance |
Passes since 2008, to the euro |
Ordinance
amounts 2016–2026; statutory formula 2008–2015 (Methods) |
|
The
self-retention amount protects a subsistence level |
Against
the at-risk-of-poverty threshold |
Holds |
Part 1, Figure 4; Destatis 2025: €1,446 against €1,450 |
|
For one
child, every band can apply |
Each
band’s upper limit minus need against its control amount |
Passes in every edition since 1979 |
All editions; Section 2 |
|
Design |
|||
|
The amounts are with reference to two dependents |
At the
top of band 1, does the income above the self-retention amount cover the need
of two children? |
Fails since 2010 for two teenagers in
every edition, for two toddlers in every edition except 2018–2020 |
Figure 9;
DFGT explanation of the 2010 edition; payment amounts: Appendix, Figure A2 |
|
The
control amount secures a balanced split between parent and children |
Can a
two-child household reach every band without falling below that band’s
control amount? |
Fails for every two-child household
since 2023: two or three phantom bands (one or two on payment amounts) |
Figures 5
and 6; worked example in the pension insurance’s own guidance (two children
aged 13 and 15, €2,500, €363 short) |
Read the table row by row and a pattern appears. Every claim about the table’s internal arithmetic holds. The amounts are monotonic and correctly derived, the minimum support is implemented to the euro, the floor sits where it is supposed to sit, and for a single child the ladder works. Whoever maintains the table maintains these properties with care.
Both claims about its design fail, and they do so for the table’s own two-dependent reference household.
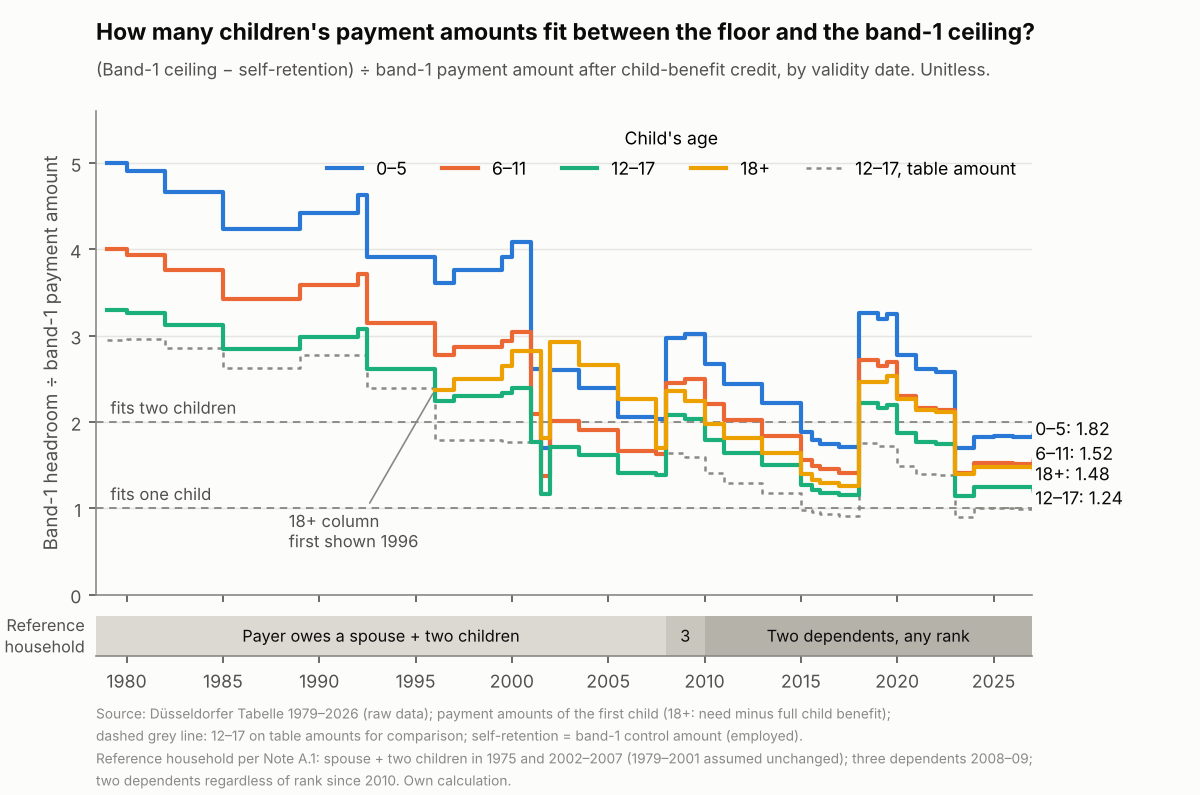
Figure 9 shows the calibration claim over time. It measures how many children’s need fits into the space between the self-retention amount and the top of band 1. The strip below the chart marks the reference household the table’s notes named in each period.
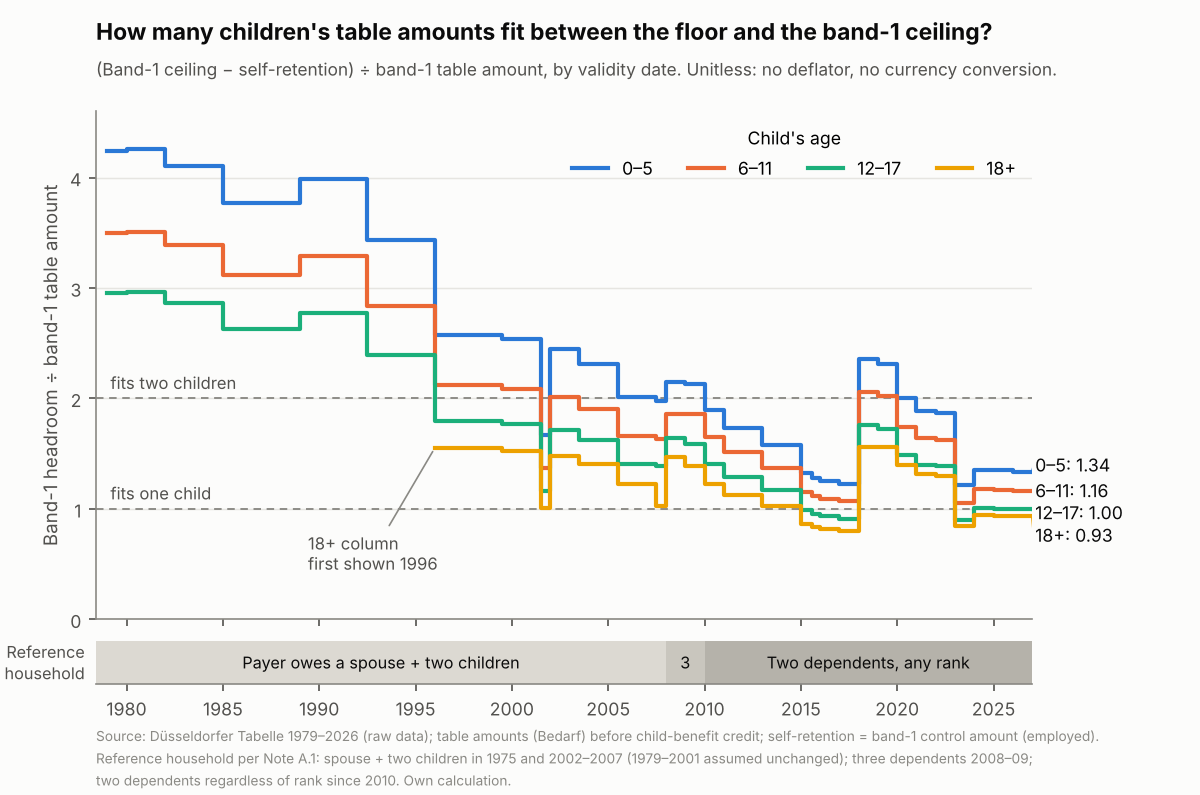
In 1979 the space at the top of band 1 held the need of almost three teenagers. Two teenagers’ need fitted 1.5 times, with room left for the spouse the table then also assumed. In 2026 it holds the need of exactly one teenager: the two teenagers’ need fits 0.5 times. Since 2010, when the table named two dependents as its reference, the teenager line has never reached 2. The household the table says it is built around no longer fits into its lowest band. The balance claim fails in the form Section 3 described: in every two-child household, at least one band in which the printed amounts and the band’s own control amount cannot both hold.
The table passes its arithmetic tests and fails its design tests.
That distinction is relevant for the question of this series. The arithmetic claims protect the children’s minimum. They are tied to statute and maintained with every edition. The design claims are the ones that would protect the parent’s incentive to earn: a reference household that fits into the bands, and a control amount that keeps a raise from vanishing into the next step. They are tied to nothing. They are stated in the notes, but nobody checks whether the numbers still satisfy them.
The failures are not the result of a decision. Nobody chose to make the reference household unaffordable at the bottom of the table, or to let its first bands drop out. These outcomes follow from parameters that move at different speeds, as Section 3 showed, and from the fact that the parameter that would have to be adjusted has no rule attached to it.
6. Nobody works for this life
Go back to the parent from Section 1 and look at the choices that remain.
The obvious one is to earn more. Section 2 showed what that buys. Up to €2,497, nothing, and up to €2,629 if the court does not apply the downgrade. Above that, a toll at every rung that turns a raise into either nothing or a loss, depending on where in the band it lands. Section 3 showed that the toll rises every time the minimum rises, while the rungs stay where they were in 2008, and that the lowest rungs are missing altogether for a two-child household. Section 4 showed that this is not a snapshot: an ordinary career with ordinary raises gained €21 a month over fourteen years, and nothing at all in the last six. Section 5 showed that the table’s own design claims, the ones that would keep a raise worth having, no longer hold.
None of this requires bad faith from anyone. The children’s minimum is set by statute and follows the cost of raising a child. The parent’s floor is set by the commission and follows the cost of living. Both are maintained with care, edition after edition. The third parameter, the structure of the bands, follows nothing:
|
Parameter |
Set by |
Follows |
|
Child’s
minimum and the steps built on it |
Statute
and ordinance (§ 1612a BGB) |
The
subsistence minimum of a child, updated with prices and wages |
|
Self-retention
and control amounts |
The
commission and the courts |
The cost
of living of the parent, roughly with wages |
|
Band
limits and band widths |
The commission |
No rule.
Widths unchanged since 2008; the first ceiling moved in 2018 and 2024 |
Part 1 described this as two closed loops and one open loop, and concluded that the corridor between them is nobody’s job. The full schedule confirms that and sharpens it. The open loop is not a single number at the bottom of the table. It runs through every band. And it is not invisible. The commission’s own introduction to the 2025 table names the unchanged €400 widths, and practitioners have described a structural dilemma “that grows from year to year” (Menne, Berliner Anwaltsblatt 2026). Everyone involved can see the band structure. Nobody is responsible for it.
The result is a schedule that imposes a marginal withdrawal rate of 100 percent across substantial income stretches and above 100 percent across the notches immediately following band borders. These stretches now occupy a substantial share of the income range relevant to Germany’s full-time working population. The table has no rate anyone voted on, no progression report, no indexation rule and no one whose task is to look at what it does to the incentive to work. A comparable burden in the benefit system, where withdrawal rates of 80 to 100 percent are routinely called a trap (European Commission DG ECFIN 2023, Tax and benefit indicators), would be a political issue. Here it is a by-product. And this comparison is not hypothetical. The OECD (2025, Economic Survey of Germany) finds effective marginal tax rates close to or above 100 percent at lower incomes and as high as 100 percent for households with children where benefits interact. It treats these rates explicitly as a labor-supply problem and calls for better coordination of the underlying transfers. The difference is not the arithmetic. Those marginal rates are measured, plotted and debated as an incentive problem. The corresponding rates produced by child support are not.
A parent in the dead zone does not have to be cynical to stop reaching for the next raise. They only have to do the arithmetic. More hours, a promotion, a better-paid job: each of these costs time and effort, and each now pays nothing, or less than nothing.
Nobody works for this life. At least, nobody should be expected to.
What follows from that is no longer a question about the table.
It is a question about people and about the economy, and it is the subject of Part 3. Four questions remain open:
- How many parents live in these zones? No official statistic counts paying parents by income and number of children. The answer has to be estimated from the earnings distribution and the number of separated families.
- How do they respond? The incentive is arithmetic. The behavior is not. The responses that follow from the mechanism are fewer hours, no overtime, no promotion, no further training, informal income, and choices about family formation: fewer further children, and caution about the commitments that trigger these obligations in the first place. The evidence on behavior is thin and mixed (Schaubert 2022, Children and Youth Services Review; Rossin-Slater & Wüst 2018, Parental responses to child support obligations; Roff & Lugo-Gil 2012, A model of child support and the underground economy; Ong 2025, The Effect of Child Support on Fathers’ Labor Supply).
- What does it cost? Raises that are never sought pay no tax and no contributions. Where a parent cannot pay, the state advances maintenance and recovers only part of it.
- Who should own the schedule, and who should sit at the table? Income tax has a progression report and indexed brackets. The benefit system has a public debate on withdrawal rates. The schedule that sets the marginal burden on paying parents has neither.
The Düsseldorf Table does what it was built to do. It secures the children’s minimum, and it does so with precision. What it no longer does is reliably ensure that earning more leaves the parent with more. Over wide stretches of the income range relevant to Germany’s full-time working population, it does not. That was never a decision. It is what happens when the amounts rise with an external benchmark while the brackets that contain them do not.
Note on the control-amount downgrade
Until 2024 the table’s notes stated that, if a band’s control amount was not met, the amount of the next lower band “is to be applied” (ist … anzusetzen, Note A.6, “from band 2”). Since 2025 they state that it “can be applied” (kann … angesetzt werden, Note III). According to the commission’s introduction, the change accommodates the diverging rules in the higher regional courts’ guidelines (Rake, FamRZ 2025, 149, 152). Courts had treated the downgrade as discretionary long before: BGH, XII ZR 161/98 (2000), and BGH, XII ZB 661/12 (2014) Rn. 39–41. The guidelines still differ today. Bremen requires the check, North Rhine-Westphalia and southern Germany leave it to the court, and the Kammergericht (Berlin) and Naumburg do not adopt it.
This essay therefore shows both readings. The downgrade does not repair the design:
- The total stays the same. The dead share of ordinary incomes and the total dead zone across the table are identical with and without it.
- It only moves the losses. For two teenagers it moves the end of the first zone from €2,629 to €2,497, and it relocates the notches rather than removing them.
- Phantom bands exist under both practices. They are defined by the table’s own control amounts. Where courts apply the check, those bands are empty. Where they do not, the parent falls below the income the same table calls necessary.
Whether a court applies the rule decides where a parent loses money, not whether they do.
Methods and data note
Parameter series is available on request. Corrections are welcome at dieter.joenssen@gmail.com and will be noted here with a date.
Sources
· Düsseldorf Table. All editions from January 1979 to January 2026: 41 periods of validity, including periods triggered by child-benefit changes. Compiled from the published tables of the OLG Düsseldorf and the archive of the Deutscher Familiengerichtstag, and from the official gazette of North Rhine-Westphalia (Justizministerialblatt) for older editions. For each period and band the dataset holds the income limits, the need by age group, the percentage of band 1, and the control amounts. Need, payment amounts and the self-retention amount are all expressed in the original currency (DM until 2001, euro from 2002).
· Child benefit. Monthly amounts by birth order, 1975–2026, from the Deutscher Familiengerichtstag’s overview and the statutory amounts. I use the full amounts for each child. The reduced, income-dependent child benefit for second and later children in 1983–1995 is not modeled.
· Prices. Destatis consumer price index, monthly, rebased to August 2026 = 100. DM amounts are converted at 1.95583 DM per euro before deflation. Real values in the text and figures are in August 2026 prices. Months after August 2026 are valued at August 2026 prices.
· Earnings. Average gross annual earnings under Annex 1 of SGB VI (2025 final value €49,147, 2026 provisional value €51,944), used only for the income path in Figure 7. Median gross annual earnings of full-time employees in 2025 (€54,066) and the at-risk-of-poverty threshold for a single person in 2025 (€1,446) are taken from Destatis.
From need to payment amount
The table’s amounts are need (Bedarf). What a parent pays for a minor child is the payment amount (Zahlbetrag): need minus the credited share of child benefit. The credit rule changed over time:
- 1979–2000 and 2008–2026: need minus half the child benefit for that child’s birth order.
- 2001–2007: § 1612b Abs. 5 BGB in its former version. Child benefit was credited only insofar as the need plus half the child benefit exceeded the amount of the 135-percent band. The credit is is max(0, ½ KG − T135 + T) where T is the need and T135 the need in the 135-percent band. From January to June 2001, the rule is applied to the July 1999 table, which was still in force.
- 2015: child benefit was raised in July 2015 with retroactive effect for the whole year. I use the legally applicable amounts (€188 for the first and second child) from January 2015.
I recalculated all payment amounts from need, child benefit and the applicable rule and checked them against the compiled values. Where birth order matters (child benefit differed by order before 1996), the older child counts as the first child.
The parent and the payment
The paying parent is employed, with one income. The income concept is adjusted net income (bereinigtes Nettoeinkommen). The self-retention amount B is the band-1 control amount for an employed parent (2026: €1,450).
For income y in band k, the household’s payment is

where Zk is the sum of the children’s payment amounts in band k. Retained income is R(y) = y − P(y). Where income does not cover the payment, the shortfall is not distributed between the children. That doesn’t change any total.
Two readings of the control-amount rule:
- Without downgrade: the band is set by income alone.
- With downgrade: the highest band j ≤ k is applied for which y - Zj is at least the control amount of band j. If no band above band 1 qualifies, band 1 applies, limited by the self-retention amount. The check is run against payment amounts, as in administrative practice (Deutsche Rentenversicherung, Beispiel 6).
Not modeled: spousal support or other obligations, moving a parent up or down a band for the number of dependents beyond the control-amount check, contact costs, and any tax effect of paying support (child support is not tax-deductible). Adjusted net income is taken as given.
Measures
· Dead zone. The income range at or above B in which R(y) is no higher than at some lower income. Computed on a €0.50 grid in the original currency, up to the upper limit of the highest band. The first dead zone runs from B to the first income at which R(y) exceeds B. A notch is a dead stretch that starts at a band border. Over the whole table, the dead stretches add up to the top band’s payment amount (Section 2, footnote 2).
· Dead share (Figure 8). The dead length between B and €4,500 in August 2026 prices, divided by the distance between B and €4,500. Computed monthly. The cap is converted into the nominal currency of each month.
· Step share (Figure 4). The rise in the household’s payment amount on entering band j, divided by the width of band j. Reported as the average over bands 2–5 and as the maximum over all bands. Bands without an upper limit are excluded.
· Within-band take (Figure 3). For each income, the share of income earned since the last band border that went to child support; in band 1, measured from B. This is a cumulative share since the border, not a point marginal rate.
· Phantom band (Figures 5 and 6). Band j ≥2 is a phantom band for a household if uj − Zj < Cj, where uj is the band’s upper limit and Cj its control amount. Figures 5 and 6 use payment amounts. On table amounts the counts are higher (2026, two teenagers: three instead of two).
· Band-1 headroom (Figure 9 and Appendix A2). (u1 − B) divided by the band-1 amount of one child: table amounts in Figure 9, payment amounts in Figure A2. The calibration test in Section 5 asks whether u1 − B covers the need of two children.
· Reference household. Taken from the wording of Note A.1:
- 1975 and 2002–2007: a payer owing support to a spouse and two children (the editions from 1979 to 2001 are assumed unchanged);
- 2008–2009: three dependents regardless of rank;
- since 2010: two dependents regardless of rank.
· Age groups. The dataset assigns all editions to the current age groups 0–5, 6–11, 12–17 and 18+. Before July 1998 the table’s age groups were defined slightly differently. The assignment treats them as equivalent.
The household in Sections 1 and 4
· Payroll example (Section 1). 2026, tax class I, child allowance factor 1.0, two children under 25, no church tax, statutory health insurance with a 1.6 percent additional contribution, Baden-Württemberg, using a standard online payroll calculator. Gross €3,780 corresponds to €2,526 net. A 5 percent flat deduction for work-related expenses gives €2,400 adjusted net income. Until 2024 the table itself allowed a flat 5 percent of net income, at least €50 and at most €150, where there were indications of work-related costs (Note A.3). Most higher regional courts’ guidelines referred to that note; some require proof of actual costs. Since 2025 the table leaves the matter to the guidelines. For a €100 gross raise the calculator gives €55.08 more net pay and €44.92 in taxes and contributions. The employer’s cost includes employer social contributions of 20.5 percent, excluding accident insurance and small levies.
· Income path (Section 4, Figure 7). Children aged 3 and 1 in 2012 and 17 and 15 in 2026, birthdays assumed at the turn of the year. Each year uses the table and child benefit in force in July, deflated with the July CPI. The growth rate of gross average earnings is applied to adjusted net income, scaled so that income reaches €2,400 in 2026. This is an illustration of an ordinary earnings path, not an estimate of any individual’s net income. The money left above the floor is R(y) - B per month, multiplied by 12. The comparison path holds income constant at €2,400 in real terms. The downgrade version is shown in Appendix, Figure A1. Holiday benchmark: Reiseanalyse 2025, spending per person and holiday trip in 2024 (€1,319).
Counterfactual and scenario (Section 3).
- The counterfactual multiplies the widths of bands 2–10 in the 2026 table by the growth of the band-1 amount since 2008 (factor 1.73–1.79, by age group).
- The scenario keeps all band limits at 2026 values and raises payment amounts by 2.3 percent a year and control amounts by 3 percent a year. Both rates are illustrative and not forecasts.
Data corrections
- 2017: control amount for non-employed parents taken from the notes.
Anomalous values checked against the original documents and confirmed:
- July 2001: band-1 ceiling of 2,250 DM.
- July 2007: adult column flat at €389 in bands 1–3.
Limits
The Düsseldorf Table is a guideline, not a statute. Courts apply it with discretion, and regional guidelines differ, especially on the control amount (see the note on the downgrade). The calculations describe what the table’s own numbers imply when applied consistently, in both readings of the downgrade. They do not describe the outcome of any individual case. The behavioral effects of these numbers are the subject of Part 3.
Appendix
Figure A1 repeats Figure 7 with the control-amount downgrade applied.
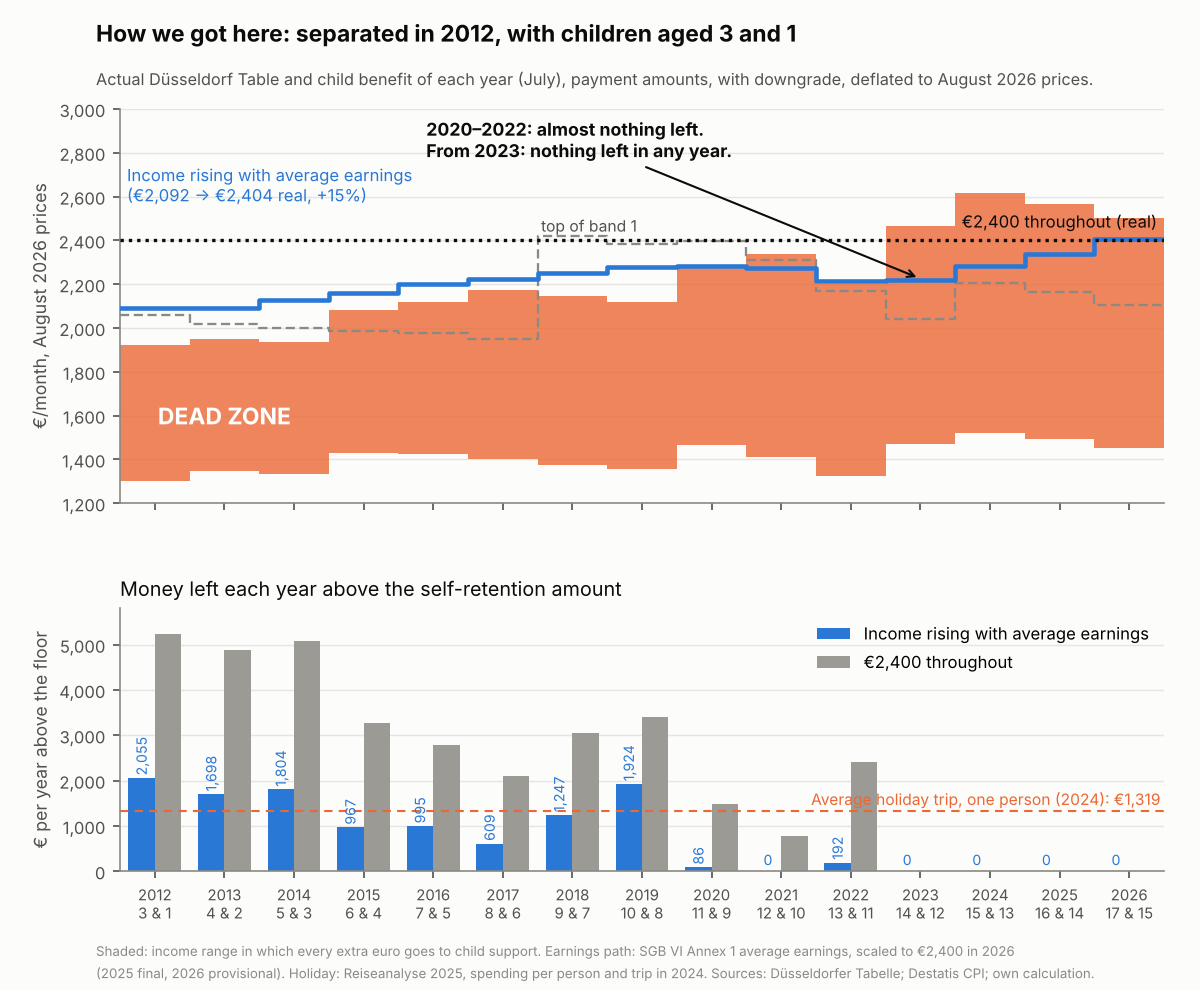
Figure A2 repeats Figure 9 on payment amounts instead of table amounts.